Note
Go to the end to download the full example code.
Errors in x and y: Ohm’s law#
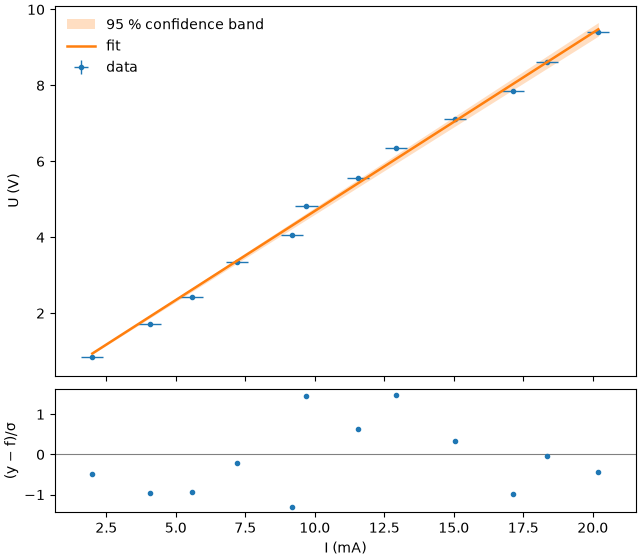
A resistor is characterized with a voltmeter and an ammeter. Both readings have
uncertainties, the current even more than the voltage. An ordinary fit treats x as exact and
underestimates the uncertainty of the resistance. With xerr, fitwise uses orthogonal
distance regression, which accounts for the errors in both variables.
import numpy as np

import fitwise as fw

rng = np.random.default_rng(12)
current_true = np.linspace(2, 20, 12)  # mA
R_true = 0.47  # kΩ, so U = R·I comes out in V
u_I, u_U = 0.4, 0.05  # instrument uncertainties: mA and V
current = current_true + rng.normal(0, u_I, current_true.size)
voltage = R_true * current_true + rng.normal(0, u_U, current_true.size)

ohm = "R*x"
Ordinary fit, current treated as exact. The χ² warning says that the voltage errors alone cannot explain the scatter:
Model:      y = R*x
Method:     Linear least squares (direct) (auto: linear in the parameters)
Converged:  yes (2 evals)
Data:       12 points, yerr given (absolute)
Start:      R: not needed (linear model)

Parameter    Value   ± Std.Err    Rel.   Bounds
R           0.4688      0.0012   0.2 %   –

χ²/ndf = 13.4 (11 dof, p = 6.4e-26)    R² = 0.9957    AIC = 32.1
Warnings:   ! χ²/ndf = 13.4 is too large for 11 degrees of freedom (p = 6.4e-26): the model does not describe the data, or yerr is underestimated
With xerr the fit is consistent, and the uncertainty of R is realistic:
Model:      y = R*x
Method:     Orthogonal distance regression (odrpack) (auto: xerr given)
Converged:  yes (31 evals)
Data:       12 points, xerr and yerr given (absolute)
Start:      R: from ordinary fit (linear model)

Parameter    Value   ± Std.Err    Rel.   Bounds
R           0.4692      0.0045   1.0 %   –

χ²/ndf = 0.886 (11 dof, p = 0.55)    R² = 0.9957    AIC = -0.5
Warnings:   none
The plot shows error bars in both directions. The residuals are normalized by the effective uncertainty √(yerr² + (R·xerr)²).
Text(0.5, 18.503588541666666, 'I (mA)')
ordinary R = 468.8 ± 1.2 Ω   (true: 470 Ω)
ODR      R = 469.2 ± 4.5 Ω   (true: 470 Ω)
Total running time of the script: (0 minutes 0.137 seconds)