Note
Go to the end to download the full example code.
Outliers: a robust fit#
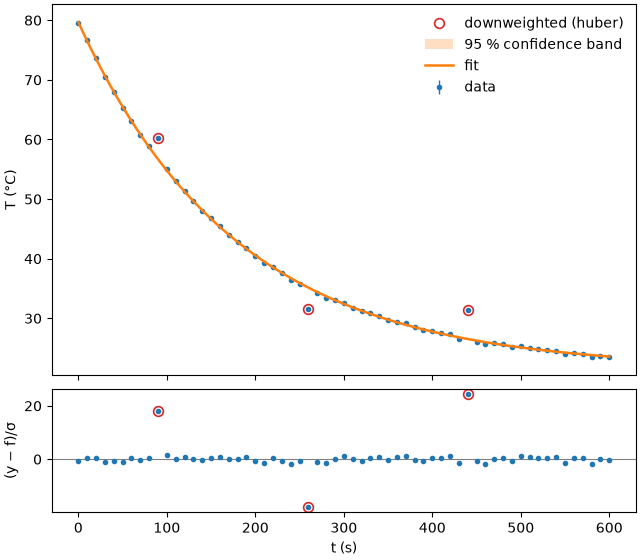
A temperature sensor cools down in air, and the logger records a few corrupted readings. An
ordinary least-squares fit is pulled towards them; loss="huber" downweights them. The
model is written as text.
import warnings

import numpy as np

import fitwise as fw

rng = np.random.default_rng(11)
t = np.linspace(0, 600, 61)  # s
temperature = 21.5 + 58 * np.exp(-t / 180) + rng.normal(0, 0.2, t.size)  # °C
temperature[[9, 26, 44]] += [4.0, -3.5, 5.0]  # corrupted readings

model = "T_room + dT*exp(-x/tau)"
The ordinary fit warns that χ² is far too large for the given uncertainty of 0.2 °C:
with warnings.catch_warnings(record=True):
    ordinary = fw.fit(model, t, temperature, yerr=0.2)
print(ordinary)
Model:      y = T_room + dT*exp(-x/tau)
Method:     Trust Region Reflective (scipy least_squares) with multi-start (auto: nonlinear, no starting values)
Converged:  yes (1689 evals)
Data:       61 points, yerr given (absolute)
Start:      T_room, dT, tau: multi-start

Parameter    Value   ± Std.Err    Rel.   Bounds
T_room      21.752       0.078   0.4 %   –
dT          58.180       0.097   0.2 %   –
tau         177.21        0.84   0.5 %   –

χ²/ndf = 21.8 (58 dof, p = 3e-226)    R² = 0.9965    AIC = 190.9
Correlations > 0.5:  T_room–tau (-0.87)
Warnings:   ! χ²/ndf = 21.8 is too large for 58 degrees of freedom (p = 3e-226): the model does not describe the data, or yerr is underestimated
The robust fit identifies the three readings and is no longer pulled by them:
robust = fw.fit(model, t, temperature, yerr=0.2, loss="huber")
print(robust)
print("downweighted readings at t =", t[robust.downweighted], "s")
Model:      y = T_room + dT*exp(-x/tau)
Method:     Robust fit (huber loss, scale 1.5) with Trust Region Reflective (auto: nonlinear, no starting values, robust (huber))
Converged:  yes (1716 evals)
Data:       61 points, yerr given (absolute)
Start:      T_room, dT, tau: from ordinary fit (multi-start)

Parameter    Value   ± Std.Err    Rel.   Bounds
T_room      21.565       0.081   0.4 %   –
dT          58.105       0.099   0.2 %   –
tau         178.88        0.87   0.5 %   –

χ²/ndf (robust) = 0.999    R² = 0.9965    AIC = 191.5
Robust:     huber loss; 3 of 61 points downweighted (weight < 0.5)
Correlations > 0.5:  T_room–tau (-0.88)
Warnings:   none
downweighted readings at t = [ 90. 260. 440.] s
fig, axes = robust.plot()
axes[0].set_ylabel("T (°C)")
axes[1].set_xlabel("t (s)")
Text(0.5, 18.503588541666666, 't (s)')
Cooling time constants in comparison (true value 180 s):
ordinary tau = 177.2 ± 0.8 s
robust   tau = 178.9 ± 0.9 s
Total running time of the script: (0 minutes 0.260 seconds)