Note
Go to the end to download the full example code.
Titration curve#
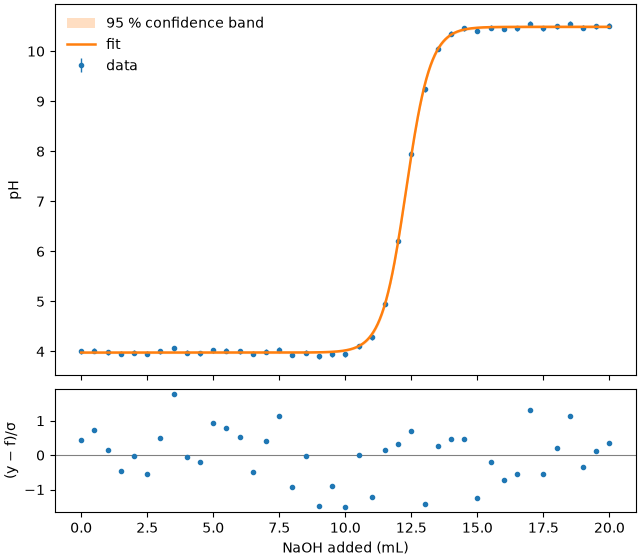
The pH during the titration of a weak acid with sodium hydroxide rises in a step around the equivalence point. A logistic step on top of a constant describes the curve well enough to locate the equivalence point precisely.
import numpy as np

import fitwise as fw

rng = np.random.default_rng(7)
volume = np.linspace(0, 20, 41)  # mL
ph = 4.0 + 6.5 / (1 + np.exp(-(volume - 12.3) / 0.45)) + rng.normal(0, 0.05, volume.size)

result = fw.fit(fw.models.sigmoid + fw.models.constant, volume, ph, yerr=0.05)
print(result)
Model:      sigmoid(x; amp, cen, width) + constant(x; c)
Method:     Trust Region Reflective (scipy least_squares) (auto: nonlinear)
Converged:  yes (25 evals)
Data:       41 points, yerr given (absolute)
Start:      amp, cen, width: step heuristic · c: edge baseline

Parameter     Value   ± Std.Err    Rel.   Bounds
amp           6.509       0.018   0.3 %   –
cen         12.3037      0.0098   0.1 %   –
width        0.4602      0.0085   1.8 %   –
c             3.978       0.011   0.3 %   –

χ²/ndf = 0.673 (37 dof, p = 0.94)    R² = 0.99983    AIC = -12.5
Correlations > 0.5:  amp–c (-0.62)
Warnings:   none
The equivalence point is the midpoint of the step:
cen = result.params["cen"]
print(f"V_eq = {cen.value:.3f} ± {cen.stderr:.3f} mL")
V_eq = 12.304 ± 0.010 mL
fig, axes = result.plot()
axes[0].set_ylabel("pH")
axes[1].set_xlabel("NaOH added (mL)")
Text(0.5, 18.503588541666666, 'NaOH added (mL)')
Total running time of the script: (0 minutes 0.135 seconds)