Note
Go to the end to download the full example code.
Radioactive decay with background#
Counts from a short-lived isotope are recorded in 10-s intervals. The counts follow Poisson statistics, so the uncertainty of each value is √N. A constant background from the environment adds to the decay.
import numpy as np

import fitwise as fw

rng = np.random.default_rng(5)
t = np.arange(0, 600, 10.0)  # s
expected = 850 * np.exp(-t / 140) + 25
counts = rng.poisson(expected).astype(float)

result = fw.fit(fw.models.exponential + fw.models.constant, t, counts, yerr=np.sqrt(counts))
print(result)
Model:      exponential(x; amp, tau) + constant(x; c)
Method:     Trust Region Reflective (scipy least_squares) (auto: nonlinear)
Converged:  yes (11 evals)
Data:       60 points, yerr given (absolute)
Start:      amp, tau: log-linear fit · c: edge baseline

Parameter   Value   ± Std.Err     Rel.   Bounds
amp           851          12    1.4 %   –
tau         141.1         3.0    2.1 %   –
c            23.4         2.6   11.3 %   –

χ²/ndf = 0.972 (57 dof, p = 0.54)    R² = 0.9930    AIC = 1.2
Correlations > 0.5:  tau–c (-0.82), amp–tau (-0.61)
Warnings:   none
The half-life follows from the decay time: T½ = τ · ln 2.
tau = result.params["tau"]
print(f"T½ = {tau.value * np.log(2):.1f} ± {tau.stderr * np.log(2):.1f} s")
T½ = 97.8 ± 2.1 s
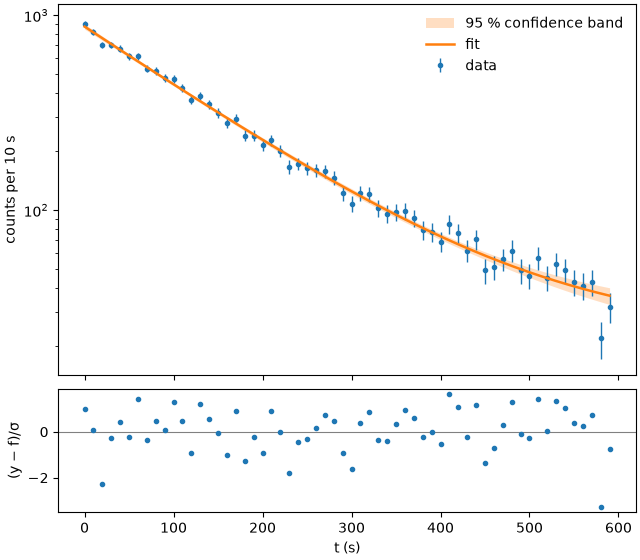
Text(0.5, 18.503588541666666, 't (s)')
Total running time of the script: (0 minutes 0.184 seconds)