Note
Go to the end to download the full example code.
Gaussian peak in three lines#
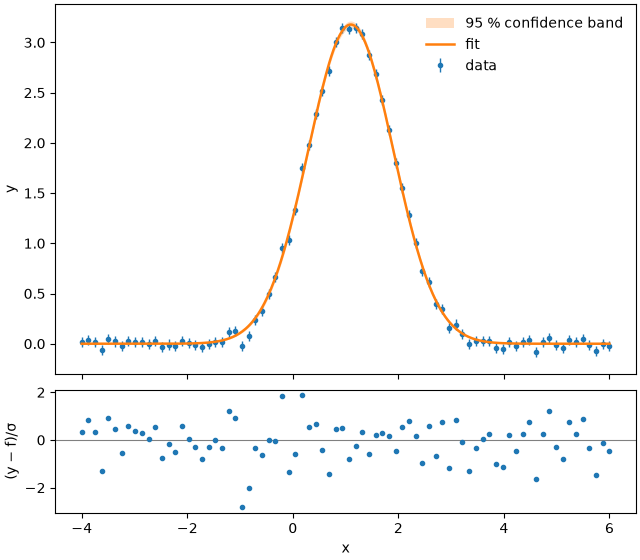
The shortest possible fit: a built-in model, data with uncertainties, a report and a plot. No starting values are needed; fitwise estimates them from the data.
Simulated measurement: a Gaussian peak with known noise of 0.05.
import numpy as np

rng = np.random.default_rng(1)
x = np.linspace(-4, 6, 80)
y = 3.2 * np.exp(-((x - 1.1) ** 2) / (2 * 0.8**2)) + rng.normal(0, 0.05, x.size)
dy = np.full_like(x, 0.05)
The fit itself:
Model:      gaussian(x; amp, cen, sigma)
Method:     Trust Region Reflective (scipy least_squares) (auto: nonlinear)
Converged:  yes (13 evals)
Data:       80 points, yerr given (absolute)
Start:      amp, cen, sigma: peak heuristic

Parameter    Value   ± Std.Err    Rel.   Bounds
amp          3.179       0.018   0.6 %   –
cen         1.0984      0.0053   0.5 %   –
sigma       0.8057      0.0053   0.7 %   –

χ²/ndf = 0.718 (77 dof, p = 0.97)    R² = 0.9983    AIC = -23.6
Correlations > 0.5:  amp–sigma (-0.58)
Warnings:   none
plot() shows the data, the fit and the residuals in units of yerr.
fig, axes = result.plot()
Individual parameters are available by name, with value and standard error:
sigma = result.params["sigma"]
print(f"FWHM = {2.3548 * sigma.value:.3f} ± {2.3548 * sigma.stderr:.3f}")
FWHM = 1.897 ± 0.013
Total running time of the script: (0 minutes 0.160 seconds)